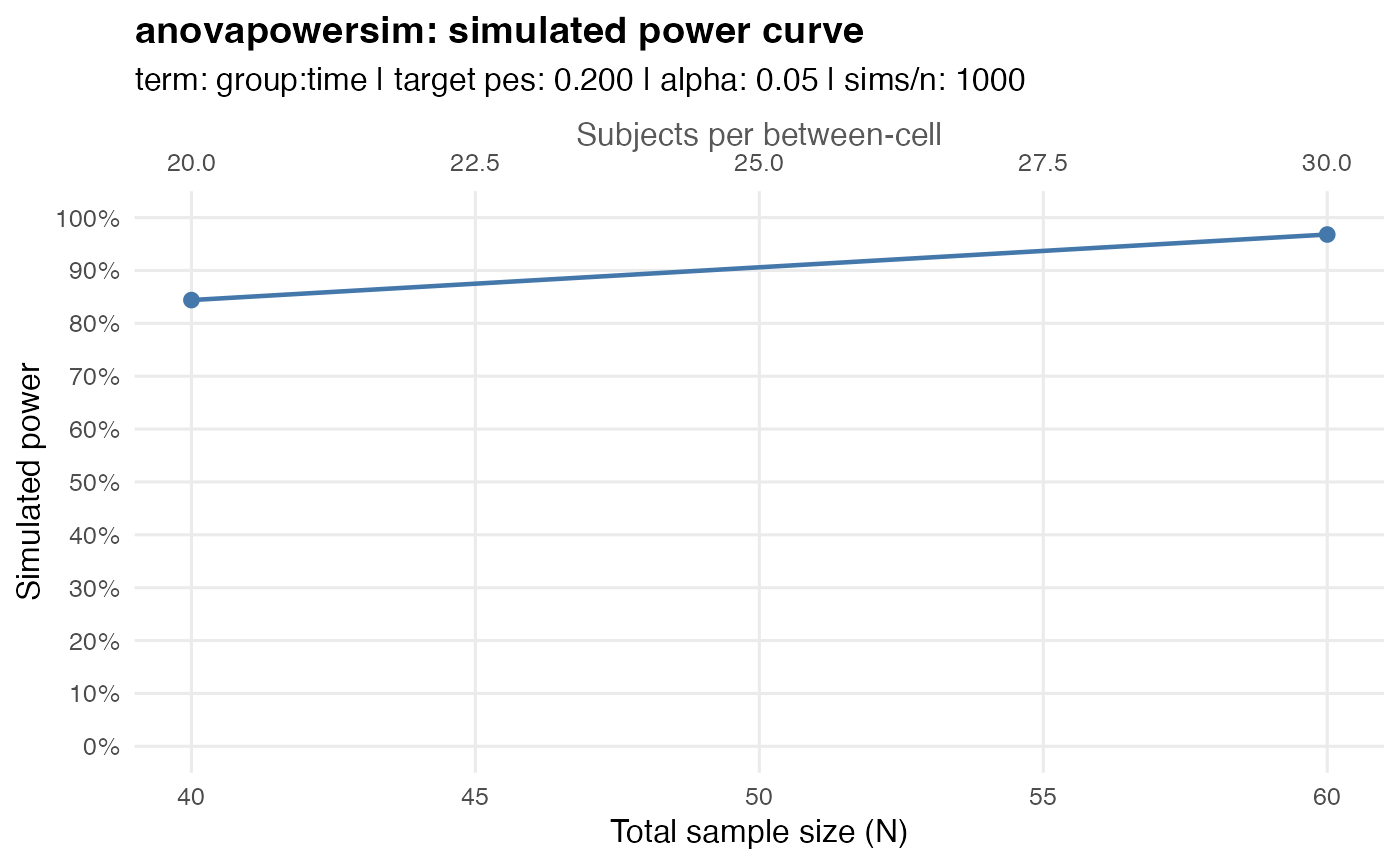
Renders an anovapowersim_curve as a ggplot2 line + ribbon with a
horizontal reference at requested power values and, when auto-search was
used, a vertical marker at the estimated required total sample size.
Arguments
- x
An
anovapowersim_curveobject frompower_curve().- show_target
Logical; draw the horizontal target power line (default
TRUE).- power_lines
Optional numeric vector of additional power reference lines, e.g.
c(.80, .90).- show_n_needed
Logical; draw the vertical line at
n_needed(defaultTRUE).- ...
Unused, for S3 consistency.
Examples
# \donttest{
pc <- power_curve(
between = c(group = 2),
within = c(time = 2),
term = "group:time",
target_pes = 0.2,
n_range = c(20, 30),
n_sims = 1000,
seed = 123
)
#> Warning: No `covariance` was supplied; using one common `sd = 1` and `correlation = 0.5` for every within-subject pair.
plot_power_curve(pc)
 # }
# }